

LEGO data analytics
A Tableau dashboard for the Maven Analytics LEGO challenge: 50 years of set themes, prices, and minifigure counts.
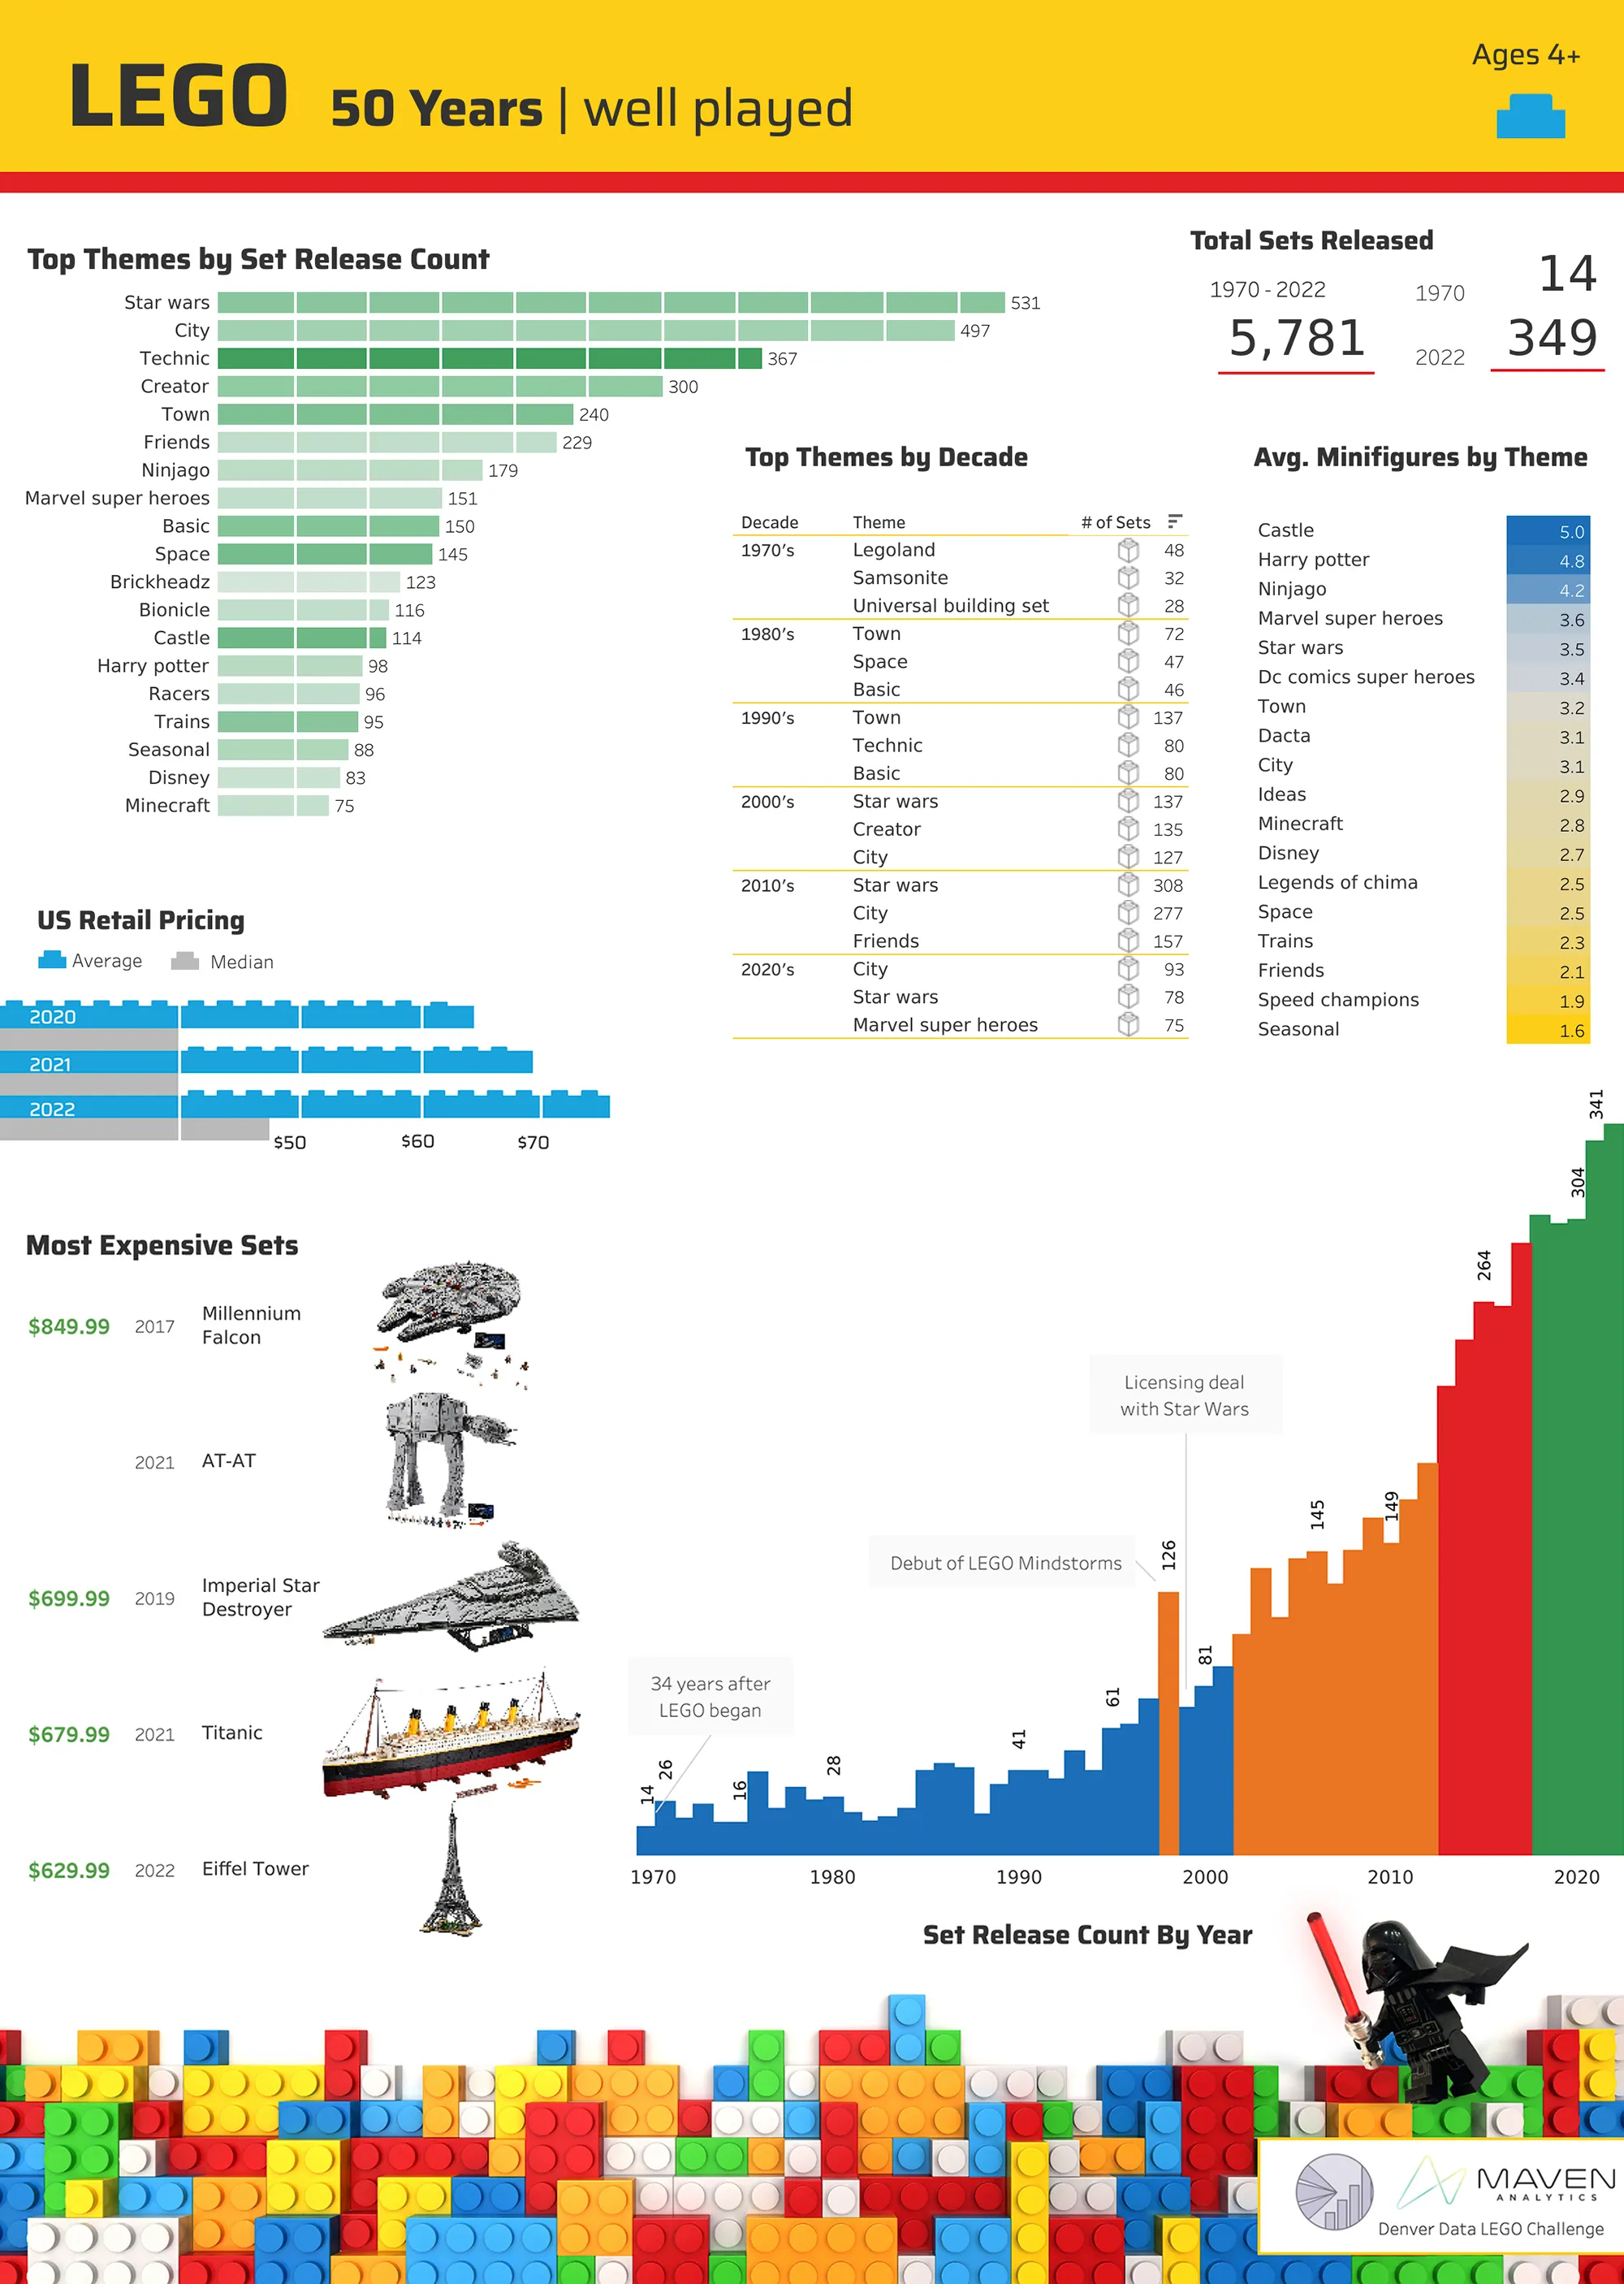
Star Wars
The skyrocketing popularity of LEGO Star Wars sets amazed me most. 80% of the LEGO sets in our home are Star Wars-themed, but I assumed this was a bias within our family. The force is strong with LEGO.
Design details
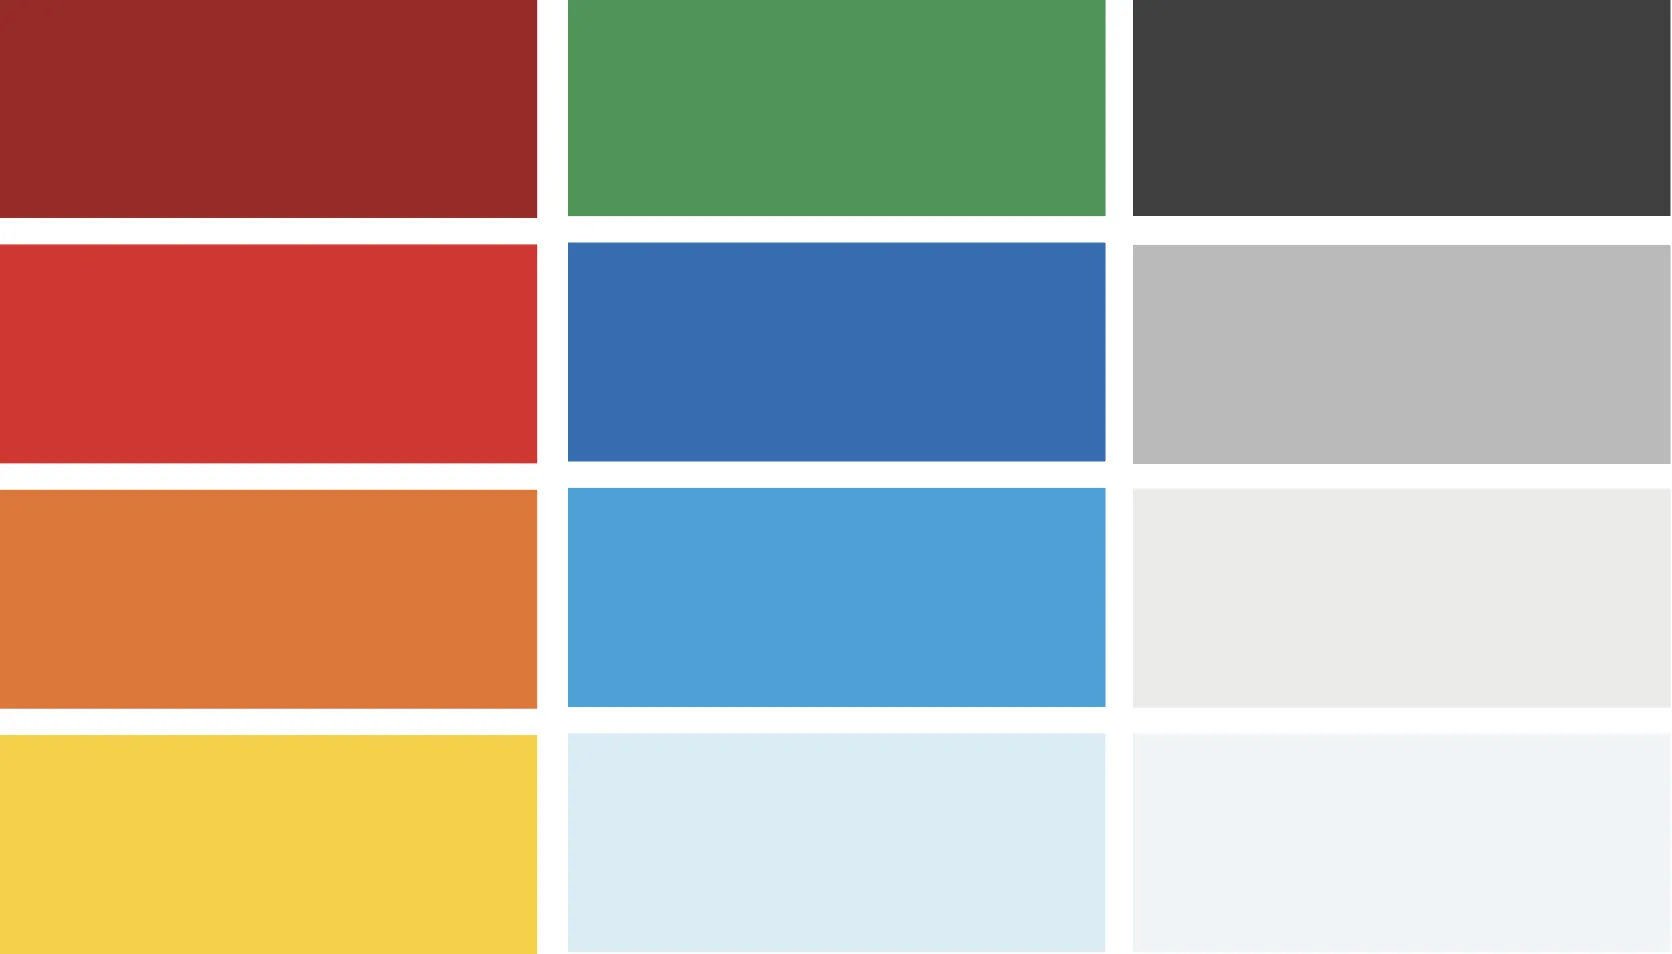
- Custom color theme inspired by the LEGO.com website and product palette
- Edward Tufte inspired details, such as vertical white divider lines and color-coded number groupings on the set count by year
- Darth Vader clip art, created in Photoshop from an image I took of one of our minifigures, glowing lightsaber and drop shadow included
- History notations: 1970 was thirty-four years after the company started, and they only released 14 sets
- Custom duck icon on the detail sheet, noting the start of LEGO’s history, which began with a clever use of wood scraps
Well Played: LEGO data visualization
LEGO means to “play well” in Danish. I have always been captivated by the creative freedom of a plethora of tiny plastic bricks. Much like LEGO encourages exploration, I included a detail sheet linked from the small blue LEGO icon for others to explore the data pieces independently. Visualizations focused on the theme transitions and LEGO nostalgia.
I focused my analysis on traditional LEGO sets, hence the “Ages 4+” notation. Duplo sets were filtered out, as were sets geared for educational or workshop use. When exploring the data, I found that limiting the analysis to sets with 100+ pieces removed most of the missing pricing data. Most of the smaller sets were promotional or polybags. These changes improved the data quality to display set themes over time. To validate this choice, considerable time was spent researching the “sets” below this threshold. Report users can bring any filtered-out sets back into view on the detail page.
Data ink
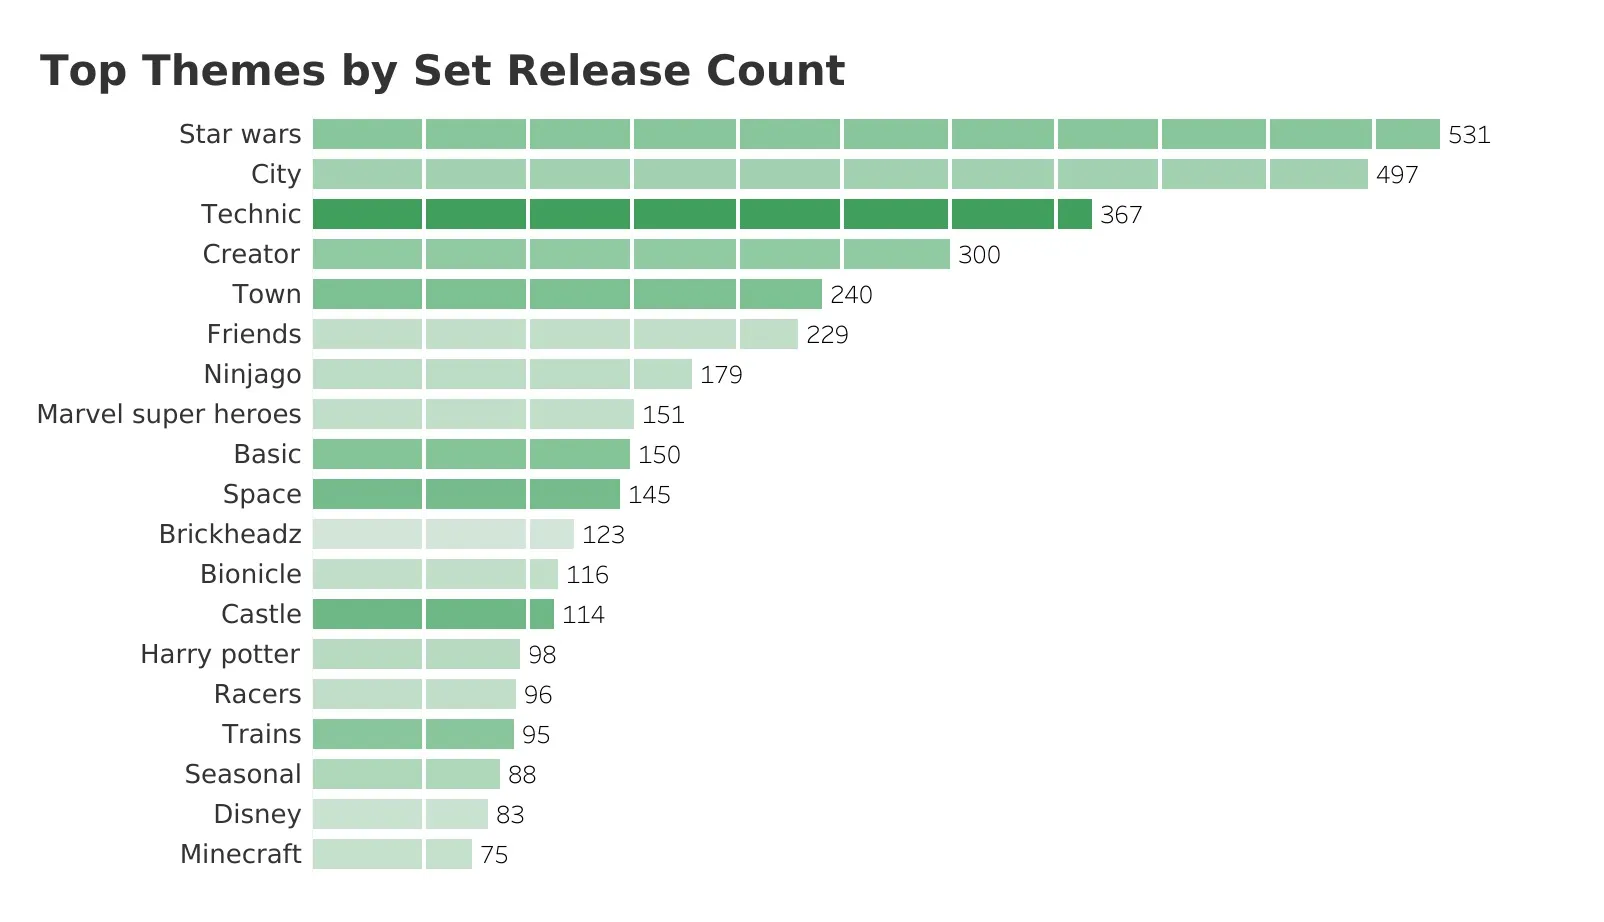
Edward Tufte, a statistician and sculptor, is considered a pioneer in data visualization. He coined the term “data-ink”: the amount of ink used to represent data divided by the total ink used in a visual. I applied Tufte’s principles by adding the grid lines to distinguish the 50-count intervals on the focal “Top Themes by Set Release Count” bar chart. Color intensity was used to layer on an additional feature of the years a theme had been produced.
Data bricks
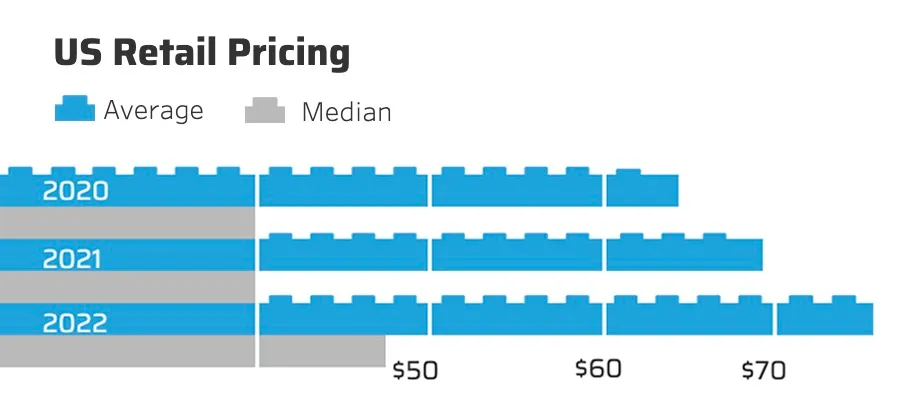
I created a set of 1x4, 1x3, 1x2, and 1x1 illustrations to layer behind the average price bars. Each little nub illustrates a $2.50 price increase, a decorative and practical data marker. My 11-year-old brought me a 1x4 for reference to ensure these pieces were to scale.
Set selection criteria
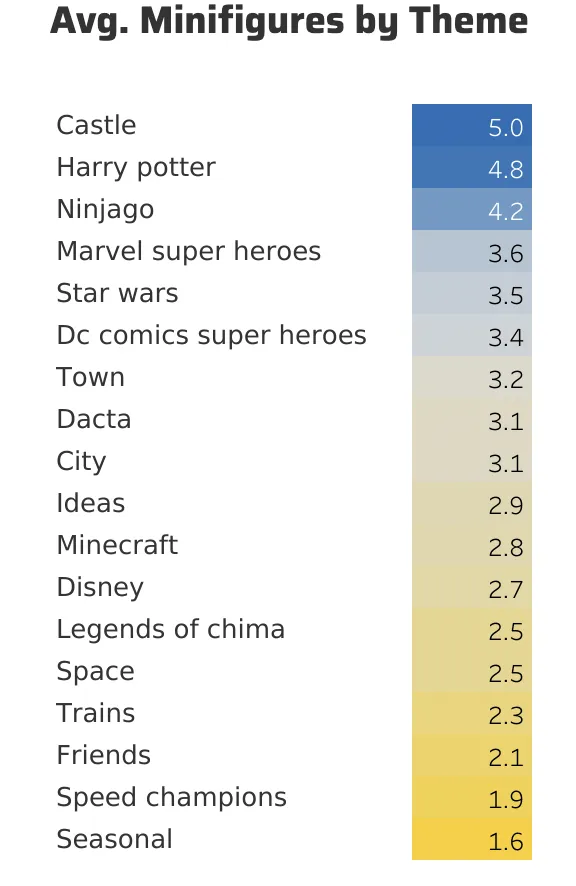
My boys are keenly aware of the minifigure count in LEGO sets they select. I created this concentration grid to show which themes had the best ratio of figures. That’s valuable information for an 11-year-old growing his minifigure collection for stop-motion movies. This LEGO data visualization benefited from filtering out the sets that were 100 pieces or fewer. A small bag of minifigures would have a high average minifigure ratio, skewing the data. This visual has an additional tooltip that shows the total number of Minifigures for these themes in addition to the Minifigure average.