

Visualizing hearing loss on a PYNQ-Z1 FPGA board
An FPGA project that lights LEDs to visualize the sounds I miss, designed to learn the silicon design process behind my work at AMD.
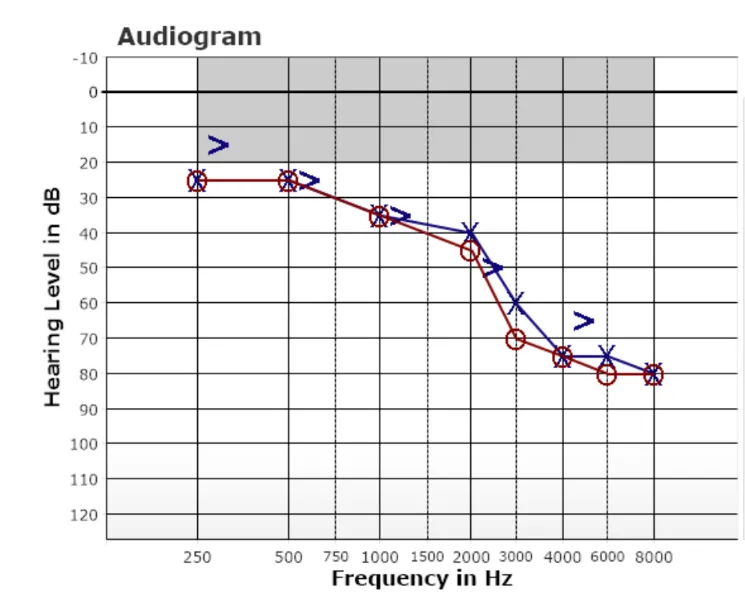
My hearing drops sharply above 2000 Hz, where much of conversational speech falls. Sounds that start with “b”, “v”, “th”, “sh”, and “f” are the hardest to process.
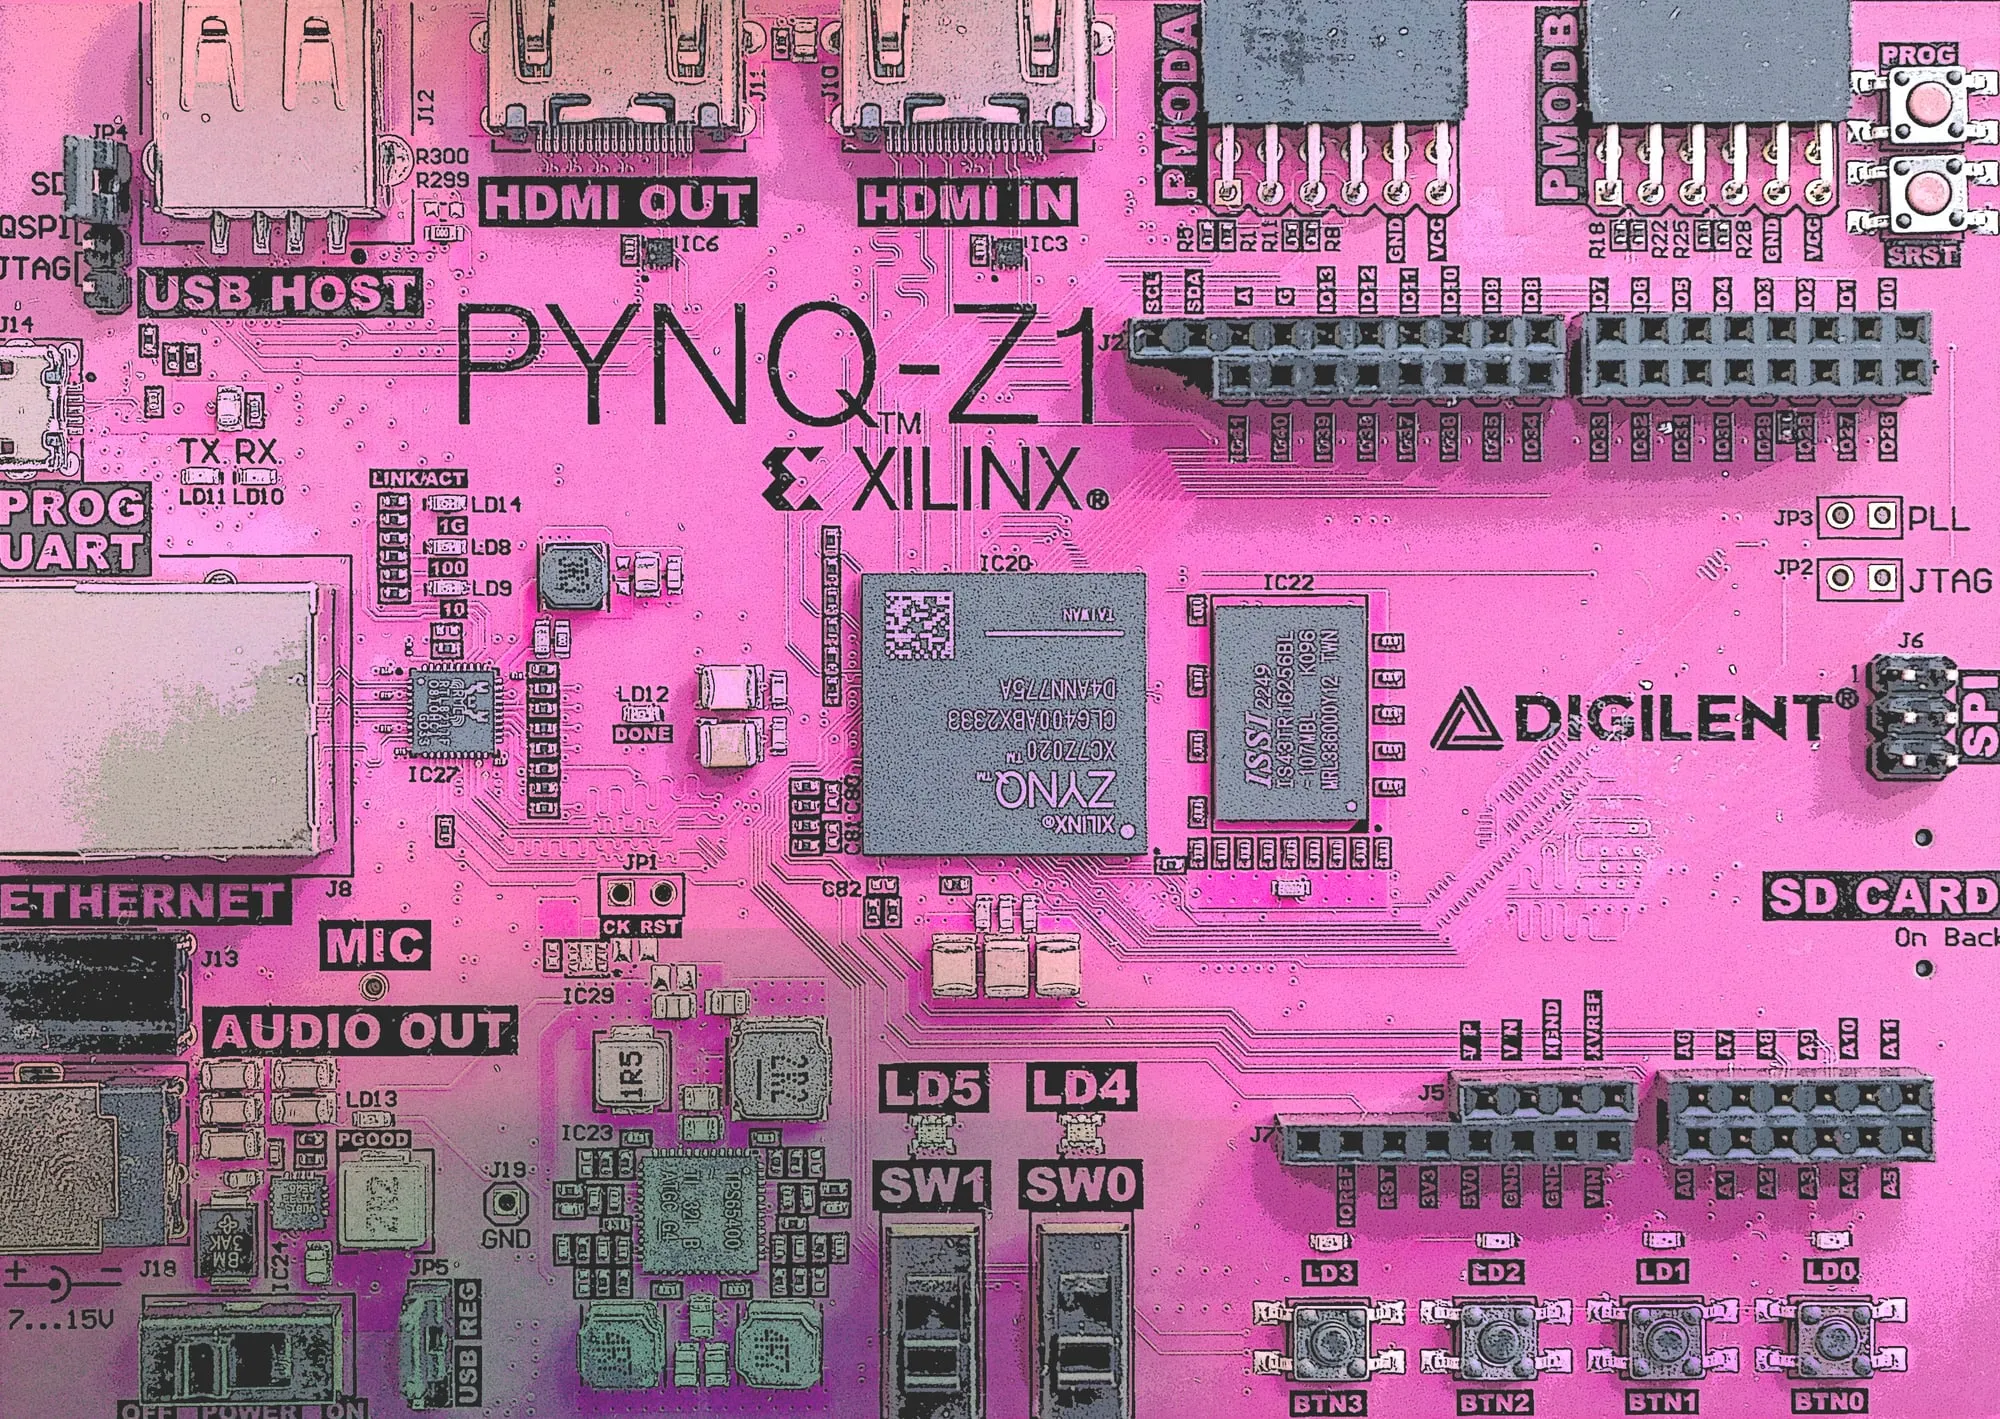
To inform my data architecture work at AMD, I’m learning the full scope of VLSI (chip) design. My electrical engineer brother helped me select an SoC (system on a chip) FPGA (field-programmable gate array) board to practice a scaled-down silicon design process.
The project phases build from a boot test to a hearing display, then a more complex algorithm. The LED display visualizes an otherwise invisible disability.
Boot test
Write an HDL (hardware description language) file that connects the push button to an LED, then boot the board to test.
Getting started:
- Look up quick boot instructions for the board: the image to load, and how to test it.
- Download Vivado on my PC.
- Use a prebuilt project if the kit includes one.
In Vivado:
- Assign pins to the location of the LED and the push button.
- Build the FPGA design.
In Vitis:
- Build a boot project.
Hearing display
Filter the microphone input for my biological hearing range in addition to my assisted range. Light LEDs for sounds I miss.
- Turn the pulse density modulated (PDM) microphone input into numbers the FIR filter can process.
- Generate two high-pass finite impulse response (FIR) filters: one with my biological hearing range, and one with my assisted hearing range.
- Take the output of the FIR filter and measure its amplitude.
- Ask AI how to measure the ambient noise amplitude of digital audio.
- Set a threshold for my ambient noise. When the noise exceeds it, light the LED.
- Consider a ratio of what I hear to what I don’t hear. Light more LEDs when I lose more information.
- Calibrate the result against my own hearing, testing with pure sine waves.
Precision
Use a fast Fourier transform (FFT) to follow my hearing loss pattern more precisely.